SEO Revenue Attribution Breaks Without Incrementality Testing

Most attribution dashboards confuse correlation for causation. Traffic climbs, revenue climbs, SEO takes the credit, and nobody asks what would have happened anyway. Incrementality testing fixes that by withholding or modifying SEO work in controlled conditions and comparing the result against a clean baseline. Geo holdouts, audience holdouts, and lift studies aren’t statistician trivia. They’re the only way to tell which slice of organic revenue is genuinely yours and which would have arrived through brand searches, direct nav, or yesterday’s PR push.
What Incrementality Testing Actually Measures
Incrementality testing measures what changed because of your SEO work. Not what happened afterward, the part Google Analytics is happy to take credit for, but the delta between “you ran the intervention” and the counterfactual world where you didn’t. Standard attribution can’t answer that. Multi-touch models distribute credit across channels based on assumptions about user journeys. Last-click hands the win to whichever touchpoint closed the conversion. Both describe; neither isolates cause.
Quick vocabulary
- Incrementality
- The portion of an outcome (sessions, conversions, revenue) that would not have occurred without the intervention being measured.
- Lift study
- A controlled test that compares a treated group against a holdout to estimate the causal lift produced by an intervention.
- Geo holdout
- A test design that withholds the intervention from a matched set of geographic regions while applying it to a paired treatment set.
- Audience holdout
- A test design that withholds the intervention from a matched cohort of users or pages, used when geography isn’t a clean split.
- Counterfactual
- The estimated outcome for the treated group had the intervention not occurred. The whole point of the control arm is to approximate it.
- Attribution vs causation
- Attribution assigns credit to touchpoints in a journey; causation isolates the touchpoint that actually changed the outcome. They are not the same number.
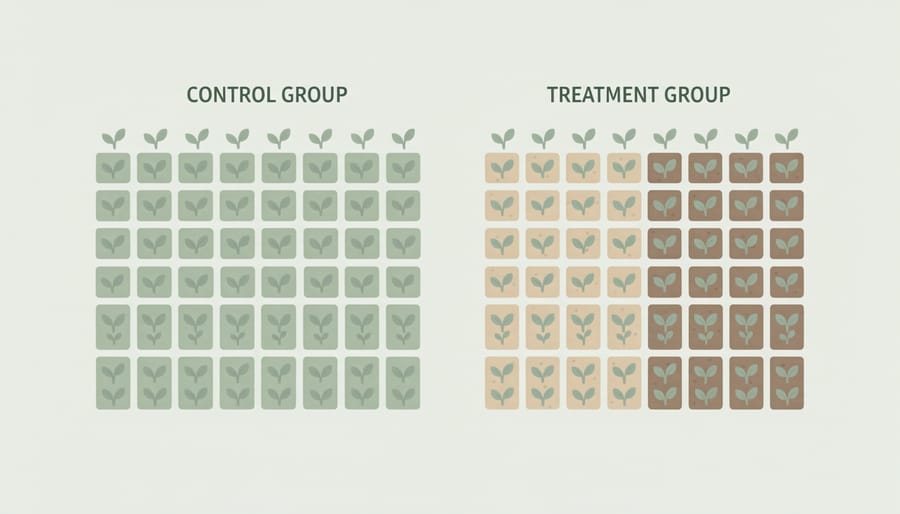
The methodology works by splitting comparable units into treatment and control cohorts. Treatment gets the SEO intervention (new backlinks, technical fixes, content optimization). Control stays untouched. Measure the performance delta between groups and you’ve isolated the lift from background trends, seasonality, and whatever other marketing motion is running in parallel.
This answers a fundamentally different question than your analytics dashboard. GA4 will tell you 10,000 conversions came through organic search. A properly designed incrementality test reveals that your recent link building campaign produced 2,300 of those, and the other 7,700 were already on their way through branded queries, returning visitors, and demand you didn’t create. Backlinko has been making this point for years: organic traffic correlates with too many things at once for raw session counts to function as a proof of impact (see their work on measuring SEO ROI).
For SEO revenue attribution, this separation transforms decision-making. You can quantify whether DR improvement actually moved the revenue needle, or whether traffic gains just cannibalized other channels. Analysts gain the rigor to compare SEO’s incremental ROI against paid channels using the same causal framework, rather than two incompatible measurement philosophies. Yes, the setup costs more than checking a dashboard. The output is correspondingly more useful.
An attribution model tells you who touched the conversion. An incrementality test tells you whether the conversion would have happened anyway.
Why Traditional SEO Attribution Misleads
Standard SEO reporting has a textbook correlation-vs-causation problem. You see conversions from organic traffic and assume your optimization work caused them. But those users might have found you anyway through brand searches, direct navigation, or offline awareness. Your SEO work just intercepted a visit that was already in motion. Branded query “captures” are the loudest version of this: the organic conversion is real, the SEO contribution (in most tests we’ve run) is roughly zero.
| Scenario | Attribution model output | Incrementality-tested truth |
|---|---|---|
| Branded query “[brand] pricing” | Credits organic search with the full conversion | Lift is near zero, user would have landed via direct nav or paid brand anyway |
| High-volume informational keyword | Last-click and data-driven models both inflate SEO’s share | Genuine lift, but smaller than the dashboard claims once branded and returning users are removed |
| New backlink campaign to a transactional page | Rankings, traffic, and revenue all rise on the same chart, credit assumed | Holdout reveals 30 to 60% of the gain tracks the control arm’s natural growth in most tests we’ve run |
| Algorithm update during a content sprint | Sprint takes the credit, the timing looks causal | Geo holdout shows control regions moved nearly the same direction, the update did the work |
| Programmatic template change | Aggregated rollout makes lift impossible to isolate from seasonality | Page-level holdout produces a clean lift estimate the dashboard never could |
Conversions from informational keywords look impressive until you remember those users were already in-market, comparing solutions across multiple channels. Did your blog post create the sale, or did it just happen to be on screen when someone was ready to buy? Traditional analytics can’t separate the signal you genuinely created from the noise of visitors who would have converted regardless. Ahrefs’s primer on SEO attribution walks through the same gap, attribution models are useful for routing credit across channels, they were never designed to prove causation.
Note
A multi-touch model can be perfectly calibrated and still report a number that has nothing to do with incrementality. The two methodologies answer different questions, attribution distributes credit, incrementality measures cause. Use them together, but never substitute one for the other.
This gap matters financially. If you’re budgeting on overstated impact, you’re misallocating resources. Incrementality testing reveals the counterfactual, what would have happened without your SEO work, giving you causation instead of convenient correlation. (Honestly, the first time you run one against a campaign you were proud of, it tends to be humbling.)
Core Incrementality Testing Methods for SEO
Three test designs cover most SEO use cases. Pick by the shape of the data you have, geography for regional businesses, page or audience cohorts for site-wide programs, time-based lift for the stuff that can’t be split cleanly.
Designing the test
Geographic Holdout Tests
Geographic holdouts split traffic by region to measure SEO’s true revenue contribution. You apply optimizations (new content, technical work, link building) to treatment regions while holding control regions constant, then compare revenue over 8 to 12 weeks. The structure isolates SEO impact from the seasonal trends and brand lift that, in theory, affect every region equally.
Start by pairing similar regions on historical revenue, traffic volume, and demographic mix. Major metros work well for e-commerce; ZIP codes or states suit local businesses tracking local SEO revenue attribution. Pair assignment to treatment or control should be random, that’s what neutralizes selection bias.
Track organic sessions, conversion rate, and revenue separately for each group. Calculate lift as (treatment revenue growth minus control revenue growth) divided by control revenue growth. If treatment regions show 15% revenue increase while control shows 3%, your SEO work drove roughly 12 percentage points of incremental growth. Account for regional ad spend, weather events, and local competitors, the longer the test runs, the more confounders you’ll need to model. Document every change made during the window and run statistical significance testing before declaring results.
Best fit for: marketing analysts proving SEO budget allocation, agencies demonstrating client ROI beyond rankings.
Audience and Page-Level Holdouts
When geography isn’t a clean split, switch the unit. Audience holdouts work at the cohort level (matched users by device, source, or behavior). Page-level holdouts group similar URLs into treatment and control. Both designs suit sites with large inventories of comparable pages, product listings, category pages, blog archives, location landing pages.
Cluster pages by traffic pattern, ranking distribution, and business value. Statistical matching algorithms work; so does simple segmentation by monthly sessions and conversion rate. Aim for at least 50 pages per cohort to clear significance, 100+ tightens the confidence interval considerably. Randomization is what keeps algorithm updates and seasonal swings affecting both arms equally.

Common interventions: targeted link acquisition (five contextual backlinks to treatment pages), content expansion (an extra 500-word FAQ block), technical optimizations (schema markup, internal linking changes). One variable per test. Measure over 8 to 12 weeks minimum. Shorter windows miss the delayed ranking response; longer ones invite contamination from unrelated launches.
Pro tip
Pre-register the hypothesis and the stopping rule before you launch. Write them down in a dated doc, “we expect treatment to outperform control by at least X% organic revenue over 10 weeks, decision threshold p<0.05.” Post-hoc reasoning is how marginal results get talked into looking decisive.
This method earns its keep on programmatic SEO, template changes propagate across thousands of algorithmically generated pages, and a 200-page test cohort tells you whether to roll the change out site-wide. Document randomization, run power calculations, prefer sequential cohorts over one giant test (they let you stop early on clearly losing variants without sacrificing rigor).
Time-Based Lift Studies
Time-based experiments are the fallback when no clean spatial or cohort split is available. You measure revenue across a baseline period, run the intervention (link building campaign, technical optimization, content refresh), then compare subsequent performance while modelling external variables. Honestly, it’s the weakest design of the three. Sometimes it’s the only one you can run.
The core challenge: seasonality and market shifts distort the signal. E-commerce sees Q4 spikes; B2B demand cycles with fiscal calendars; algorithm updates hit everyone simultaneously. Without controls, you can’t separate SEO impact from any of that.
Robust time-based tests need year-over-year comparisons across the same calendar window to neutralize seasonal patterns. Track competitor rankings and organic visibility during the test window, if they’re rising too, broader algorithm shifts may explain your gains rather than your work. Moz’s guidance on SEO experiments argues the same point from a slightly different angle, you can’t trust a single-arm trend chart without instrumented controls in the surrounding noise.
Monitor paid-search spend, PR mentions, and brand-search volume as proxies for external demand. Statistical process control charts help flag when changes exceed normal variation. Establish confidence intervals from historical volatility, then flag results that breach those thresholds as potentially causal rather than noise.
Why it’s interesting: accessible to teams without engineering resources for complex splits, though strictly less definitive than a geo or page-level holdout.
Best fit for: marketing analysts who control the timing of SEO initiatives and have clean historical data across multiple cycles.
Measuring Link Building Incrementality
Link building incrementality requires isolating the causal effect of acquired backlinks from natural ranking fluctuations. Most teams struggle because new links correlate with existing growth trajectories, attribution is unreliable when both signals move in the same direction.
Start with a clean baseline. Select pages that meet three criteria: stable traffic for 90+ days, no recent content updates, similar topical relevance. Split them into test and control groups using matched-pair randomization on current rankings, traffic volume, and conversion rate.

Execute the link campaign exclusively on test pages for 60 to 90 days while monitoring both groups. Track rankings and traffic, of course, but also downstream revenue, conversion rate, AOV, affiliate revenue impact. The difference between groups reveals true incrementality.
For holdout group selection, avoid cherry-picking high-potential pages. Use stratified sampling across keyword difficulty tiers and funnel stages. Pages serving informational intent need longer attribution windows than transactional queries, typically 120+ days versus 60 for transactional.
Calculate incrementality as (test group revenue lift minus control group revenue change) divided by link acquisition cost. If test pages gain $50,000 in incremental revenue while controls stay flat and links cost $15,000, your return is 3.3x. Negative results matter too, they reveal when link campaigns underperform organic growth, and that’s the diagnostic that protects future budgets.
This framework works best with 20+ page pairs minimum. Smaller tests lack statistical power, noise becomes indistinguishable from signal. Run multiple cohorts quarterly to account for seasonality and algorithm shifts.
What Valid Test Results Look Like
Valid test results require meeting three statistical thresholds before you can trust the findings.
Aim for 80% statistical power with 95% confidence intervals (the standard in scientific research). That typically demands sample sizes of 1,000+ pages per variant, or 8 to 12 weeks of continuous traffic data, depending on site volume. Smaller sites? Longer test durations, to accumulate enough observations.
Calculate your minimum detectable effect size before launching. If you need to detect a 5% revenue lift but daily traffic variance is 15%, the test will produce noise, not signal. Run a pre-test analysis examining coefficient of variation in your baseline period, anything above 20% means you’ll struggle to isolate incrementality without a much longer window or much larger sample.
Watch for
Three failure modes invalidate results no matter how clean the math looks. Overlapping test periods where multiple experiments contaminate each other’s control arms. Seasonal distortions like holiday traffic spikes mid-test. External shocks (algorithm updates, competitor outages, paid-channel pauses) that move both arms unequally. Each one contaminates the control group and your effect estimate.
Your p-value should fall below 0.05, but don’t stop there. Examine effect-size magnitude, a statistically significant 0.3% revenue increase may not justify ongoing investment. Calculate confidence intervals around your point estimate, if the range spans -2% to +8%, you haven’t isolated true incrementality yet.
Run sensitivity analyses by segmenting results across device types, traffic sources, and page categories. Consistent directional effects across segments signal robust findings. Wildly inconsistent direction across segments usually signals a statistical artifact rather than a real lift.

Common Implementation Pitfalls
Even rigorous tests fail when execution stumbles. The traps:
Sample size matters more than intuition suggests. Underpowered tests produce false negatives. You miss real lift because noise drowns the signal. Calculate minimum detectable effect before launch (with 80% power as your floor, not your ceiling), not after.
Control group contamination kills validity. If your “no-SEO” pages still rank organically or share navigation with treated pages, you’re measuring muddied water. True isolation requires clean separation, structurally similar pages, no internal-link bleed, no shared canonical hubs.
Seasonality blindness distorts results. Running tests through Black Friday or ignoring day-of-week patterns conflates calendar effects with treatment effects. Compare like periods or model cyclical patterns explicitly.
Premature stopping wastes investment. Peeking at results daily and calling winners early inflates false positives. Commit to test duration upfront based on traffic volume and expected effect size. (I’ve watched this kill more campaigns than any algorithm update, the team peeks at week three, sees a swing, declares victory, and never finishes the test that would have caught the regression.)
Statistical significance is not business impact. A 2% revenue lift can be “significant” at p<0.05 and still irrelevant if implementation costs exceed gains. Translate findings into dollar terms and ROI before declaring success.
Worth the Holdout, or Trust the Attribution Model?
Incrementality testing earns its overhead on high-stakes decisions. For routine reporting? A properly calibrated attribution model is usually enough.
✓
Worth the holdout for
- ›Annual SEO budget decisions tied to a specific revenue number
- ›Link-building programs you need to defend to a finance team
- ›Template or programmatic rollouts where the blast radius is huge
- ›Channel-mix arguments where SEO is being compared head-to-head with paid
- ›Anything where branded search inflation makes the attribution number suspect
✗
Trust the attribution model for
- ›Weekly or monthly reporting cadence to operators
- ›Quick directional reads on a single tactic’s traction
- ›Sites with too little traffic to power a holdout (under ~30k sessions/mo)
- ›Editorial or PR placements where the value isn’t primarily revenue
- ›Early-stage launches where you’re still building enough baseline to test against
Incrementality testing transforms SEO from a cost center into a measurable revenue driver by isolating causal impact from background noise. Unlike attribution models that credit every touchpoint, incrementality reveals which SEO investments actually create new revenue versus those that simply take credit for traffic that would have arrived anyway. That matters when proving ROI to stakeholders who demand evidence, not assumptions.
Try it this week
Pick one campaign. Hold back a control. Measure the delta for 8 weeks.
-
1
Identify a high-traffic page template or a regional segment where you can hold a clean control. Pre-register your hypothesis and the stopping rule in writing. -
2
Run the intervention on the treatment arm only. Document every other change made on-site during the window so you can rule out confounders later. -
3
At week 8, compare treatment minus control as a percentage of baseline. Report the point estimate and the confidence interval. The interval is what gives the number credibility.
Once you’ve run one, you’ll never trust an un-controlled SEO revenue chart the same way again, that’s the whole point.
Related guides
- Stop Guessing If Your Link Building Actually Works, The measurement frame for link campaigns when the dashboard isn’t enough.
- Managed Link Building, How we structure campaigns so their incrementality is measurable from day one.

